Affordability
Table of Contents

Summary
An estimated 54.3% of Egyptians are considered cost burdened. Median rents or house prices surpass what they can comfortably afford: 59.4% of households would have to pay more than 25% of their monthly income to rent the median priced home (EGP 800). While almost half of households (49.2%) would not be able to buy the median home which at EGP 225,000 surpassed the House Price to Income (HPI) ratio of 6.6.
How is housing affordability a problem?
Poorer households are forced to spend more of their already stretched incomes on housing. This forces them to spend from their savings, forfeit leisure activities, and finally they begin spending money that would otherwise be spent on essentials such as health, education and food.
If incomes still cannot match rents or debts, families are forced to relocate to or build inadequate housing lacking: access to safe water, improved sanitation, secure tenure, durability or housing that is overcrowded.

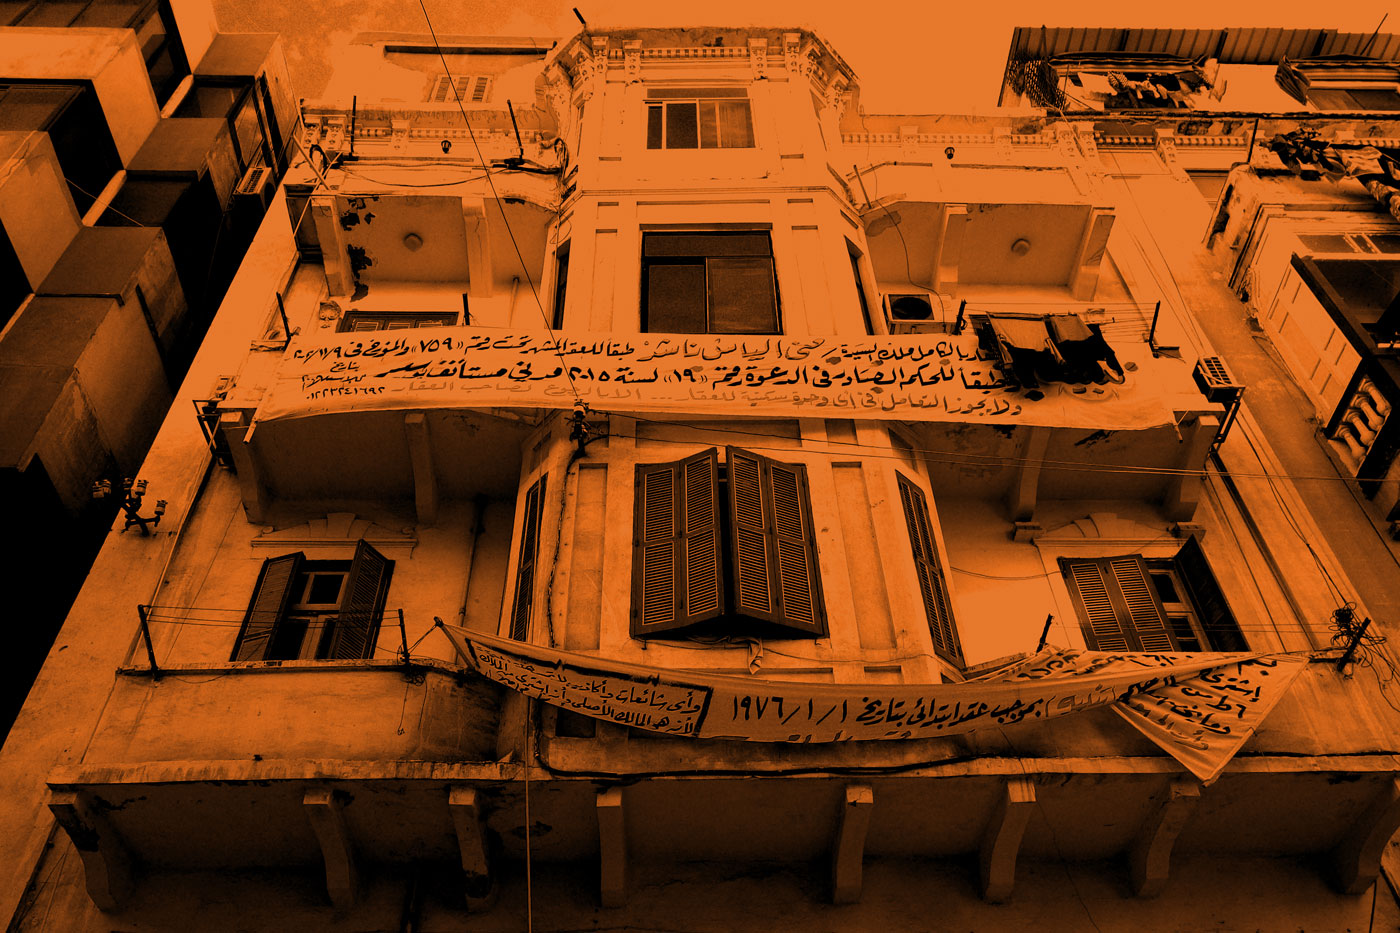
Skyline of the Bulaq Corniche in Cairo, with “prime real estate” fronting a working class neighbourhood | 10Tooba
Who finds housing unaffordable in Egypt?
Overall the least affordable region was Upper Egypt. Between 55% to 89% of households in this region could not afford to buy or rent the median priced home. Unaffordability in the Suez Canal cities varied between 51% and 97%, while in the Delta it ranged between 31% and 91%. In Greater Cairo the median rents and prices were beyond the reach of between 41% and 67% of households. The Frontier governorates had the least cost burden which was still high, where up to 48% of households were not able to afford median rents or prices.
Rent was most expensive in Port Said: there 97% of households have to pay more than a quarter of their income to rent the median priced home. In the other Suez Canal cities renting was also high where it burdened 79.4% and 69.2% of households in Ismailia and Suez respectively. Renting was also very expensive in Upper Egyptian cities: between 71.8% and 95.4% of households were burdened. Cost burdened households in Greater Cairo varied between 40.3% and 75.7% for Giza and Cairo respectively. In the Delta the cost burden was also varied, between 34.7% in Kafr al-Sheikh, to 95.2% in Damietta.
For buyers, Sohag was the most unaffordable city: 98.1 % of households could not afford the median priced home. This was similar in most Upper Egyptian cities where over 80% of households could not buy the median priced home in Assiut, Fayoum, Aswan, Luxor and Qena. Port Said and Damietta were also highly unaffordable with 97% and 94.4% of households respectively unable to buy the median priced home.
Why is housing becoming more unaffordable in Egypt?
The Egyptian housing market suffers from gross deregulation. Speculative buying and exclusive housing dominate the market.[1] This has meant that growth in land and house prices has been far outstripping growth in income. Over the last eight years house prices in Egypt have grown by 19.6% annually,[2] whereas average incomes only grew by 5.4% per year over the same time frame (both house prices and incomes are not adjusted to inflation).[3]
What can be done?
- The introduction of policy and legislation to regulate the housing and land market can go a long way to reducing the gap between prices and incomes, especially through redesigning both real-estate taxes and capital gains taxes.
- Increasing the transparency of the land and property market can help buyers and renters know what the fair market price for housing is in different areas, this can be done through a national publicly accessible database of land and property prices.
- The land market needs to be decommodified, this can be done by offering state land only through long-term leases and not for outright sale.
- A multi-option subsidised housing programme (rather than the current single option Social Housing Programme) that offere a wide range of support including: rent vouchers, repair grants, rental units and subsidised land plots would be able to address much more of the poor and the severely cost burdened.
Methodology
Definition of affordability
Housing affordability is one of the fundamental elements of the right to adequate housing as “housing is not adequate if its cost threatens or compromises the occupants’ enjoyment of other human rights”[4]. Moreover, the United Nations Human Settlements Programme (UNHABITAT) states that access to adequate housing means that housing expenditures do not take up an undue portion of households’ income.[5]
The main determinant of affordability is house prices and rents responding to all segments of the population, especially the lowest segment. Accordingly, Australia defined affordable housing as “…reasonably adequate in standard and location for lower or middle income households and does not cost so much that a household is unlikely to be able to meet other basic needs on a sustainable basis”[6]
Quantitative Measurement of Affordability
Housing affordability is measured in a number of ways. For buyers the most common method is the house price to income ratio (HPI), which calculates the “ratio of the median free-market price of a dwelling unit and the median annual household income”[7]. Defining an affordable HPI varies greatly from country to country, as it depends on the availability of mortgages, their tenure and interest incurred, as well as the maximum accepted proportion of household income spent on housing (see below). In Egypt, the mortgage market is far from mature. Buyers tend to buy off plan and pay in instalments that cover more than half the value of the unit before they move in. A smaller proportion pays in cash up front. Calculating an affordable HPI for Egyptians has been very complicated. Had we used a market mortgage HPI (2.0),[8] or that of subsidised mortgages (3.3),[9] almost all households would have been unable to afford the median house price. Therefore we have chosen to use an HPI of 6.6, which is double that of the subsidised rate. This is on the assumption that real-world purchases depend largely on being able to afford paying half the unit price as a down payment (whether from long term savings, help from families, selling off assets, foreign remittances or formal and informal personal loans).
As renters make up a large portion of residents, affordability can also be measured through calculating the rent to income ratio (RI) as the “ratio of the median annual rent of a dwelling unit and the median annual household income.”[10] Defining at which ratio rents (or mortgage instalments) are affordable, a benchmark based on the maximum accepted proportion of a households’ income spent on housing should be used.[11] This benchmark varies between countries (Table 1). Based on this,we have chosen to use a benchmark of 25% for Egypt where household spending on basics such as food, health and education is high compared to the other countries in the table..
Table 1: Official rent-to-income ratios in selected countries
| Country | Housing cost should not exceed (x)% of the households’ income |
| United States[12] | 30% |
| Canada[13] | 30% |
| New Zealand[14] | 25% – 30% |
| India[15] | 40% |
| Egypt[16] | 35% – 40% |
Methodology for calculating affordability in Egypt
The housing affordability indicator is comprised of the average between the percentage of households who cannot afford to buy the median priced home at an HPI ratio of 6.6, and the percentage of households who cannot afford to rent the median priced home at an RI of 25%.
Median house prices for fully finished units and median rents (so-called New Rent only, excluding Old Rent/rent control units) were collected through primary sources for provincial capitals in each of Egypt’s 27 governorates in June 2016 based on representative sampling (Table 2).[17]
Household incomes for each governorate in 2016 were forecasted from Central Agency for Public Mobilization and Statistics (CAPMAS) Household Income, Expenditure and Consumption Surveys (HIECS) for the years 2008/2009, 2010/2011 and 2012/2013.[18] Only 50% of the full dataset was made available.
Footnotes
[1] Shawkat 2015. Egypt’s Deregulated Property Market: A Crisis of Affordability, MEI 05.05.2015 http://www.mei.edu/content/at/egypts-deregulated-property-market-crisis-affordability
[2] Comparing house price data from the National Urban Observatory gathered in 2008 and data gathered by the BEDI in 2016. See more in the methodology section below.
[3] According to forecasted data from the Egypt – Household Income, Expenditure, and Consumption Surveys, (HIECS) between 2008/2009 and 2012/2013. See more in the methodology section below.
[4] United Nations High Commissioner for Human Rights. (2014, May). The Right to Adequate Housing. The Right to Adequate Housing (No.21). Geneva.
[5] United Nations Human Settlements Programme. (2004, August). Urban Indicators Guidelines, Monitoring the Habitat Agenda and the Millennium Development Goals. Nairobi.
[6] Affordable Housing Consortium, Australia, http://www.qahc.asn.au/
[7] United Nations Human Settlements Programme. (2004, August). Urban Indicators Guidelines, Monitoring the Habitat Agenda and the Millennium Development Goals. Nairobi.
[8] A USD 23,737 home would only be affordable to a household with a USD 12,000 annual income, leading to an HPI of 2.0. Based on a mortgage at a market interest rate of 12% covering 10% of the unit price over 25 years where monthly instalments do not exceed 22.5% of income. From al-Ahli United Bank in: Centre for Affordable Housing Finance in Africa, Calculating Mortgage and Housing Affordability in Africa. March 14th, 2016 http://www.housingfinanceafrica.org/calculating-mortgage-and-housing-affordability-in-africa/
[9] An EGP 122,700 home would only be affordable to a household with an annual income of EGP 36,831 leading to an HPI of 3.3. Based on a mortgage at a subsidized rate of 7% covering 85% of the unit price where monthly instalments do not exceed 25% of household income. Guarantee & Subsidy Fund (GSF), Central Bank Low Income Mortgage Initiative Amortisation Schedule, December 2014. Internal document.
[10] United Nations Human Settlements Programme. (2004, August). Urban Indicators Guidelines, Monitoring the Habitat Agenda and the Millennium Development Goals. Nairobi.
[11] Robinson, M., Scobie, G. M., & Hallinan, B. (2006, March ). Affordability of Housing:Concepts, Measurement and Evidence. New Zealand Treasury.
[12] U.S. Department of Housing and Urban Development, http://portal.hud.gov/hudportal/HUD?src=/program_offices/comm_planning/affordablehousing/
[13] Canada Mortgage; Housing Corporation (28 September 2011)
[14] Robinson, M., Scobie, G. M., & Hallinan, B. (2006, March ). Affordability of Housing: Concepts, Measurement and Evidence. New Zealand Treasury.
[15] Hulchanski, J. D. (1995). The concept of housing affordability: Six contemporary uses of the housing expenditure to-income. Housing Studies: 10(4), p471.
[16] National Bank of Egypt, Central Bank Initiative for Low and Middle-income Mortgages, n.d. http://www.nbe.com.eg/Default.aspx?AID=5&CID=7 Accessed 18.09.2016
[17]Provincial capitals were divided into 5 sections (North, South, Centre, West, East) and systematic random samples were used to select the urban census blocks (Shiakhas) that would be covered.
[18] Egypt – Household Income, Expenditure, and Consumption Survey, HIECS 2004/2005 OAMDI, 2014. Harmonized Household Income and Expenditure Surveys (HHIES),http://erf.org.eg/data-portal/. Version 2.0 of Licensed Data Files; HIECS 2004/2005 – Central Agency for Public Mobilization and Statistics (CAPMAS). Egypt: Economic Research Forum (ERF). Egypt – Household Income, Expenditure and Consumption Survey, HIECS 2008/2009 OAMDI, 2014. Harmonized Household Income and Expenditure Surveys (HHIES),http://erf.org.eg/data-portal/. Version 2.0 of Licensed Data Files; HIECS 2008/2009 – Central Agency for Public Mobilization and Statistics (CAPMAS). Egypt: Economic Research Forum (ERF). Egypt – Household Income, Expenditure, and Consumption Survey, HIECS 2010/2011 OAMDI, 2014. Harmonized Household Income and Expenditure Surveys (HHIES),http://erf.org.eg/data-portal/. Version 2.0 of Licensed Data Files; HIECS 2010/2011 – Central Agency for Public Mobilization and Statistics (CAPMAS). Egypt: Economic Research Forum (ERF). Egypt – Household Income, Expenditure, and Consumption Survey, HIECS 2012/2013 OAMDI, 2014. Harmonized Household Income and Expenditure Surveys (HHIES),http://erf.org.eg/data-portal/. Version 2.0 of Licensed Data Files; HIECS 2012/2013 – Central Agency for Public Mobilization and Statistics (CAPMAS). Egypt: Economic Research Forum (ERF).